This is a single zone residential hydronic system model for WP 1.2 of IBPSA project 1.
This building envelope model corresponds to the BESTEST case 900 test case. It consists of a single zone with a rectangular floor plan of 6 by 8 meters and a height of 2.7 m. The zone further consists of two south-oriented windows of 6 m2 each, which are modelled using a single window of 12 m2.
The walls consist of 10 cm thick concrete blocks and 6 cm of foam insulation. For more details see IDEAS.Buildings.Validation.Data.Constructions.HeavyWall. The floor consists of 8 cm of concrete and 1 m of insulation, representing a perfectly insulated floor. The roof consists of a light construction and 11 cm of fibreglass.
The zone is occupied by one person before 7 am and after 8 pm each weekday and full time during weekends.
There are no internal loads other than the occupants.
The model uses a climate file containing one year of weather data for Brussels, Belgium.
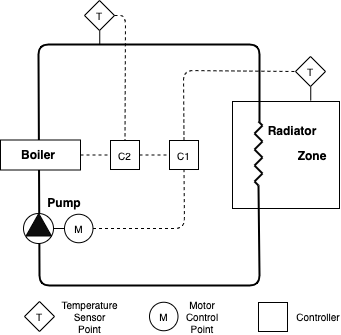
The model only has a primary heating system that heats the zone using a single radiator with thermostatic valve, a circulation pump and a water heater. The system is presented in Figure 1 below. The radiator nominal thermal power and heater maximum thermal power is 5 kW. The heating setpoint is set to 21 °C during occupied periods and 15 °C during unoccupied periods. The cooling setpoint is set to 24 °C during occupied peridos and 30 °C during unoccupied periods. The gas heater efficiency is computed using a polynomial curve and it uses a PI controller to modulate supply water temperature between 20 and 80 °C to track a reference for the operative zone temperature that equals the heating setpoint plus an offset of 0.1 °C by default.
The heating system circulation pump has the default efficiency of the pump model, which is 49%; at the time of writing. The heater efficiency is computed using a polynomial curve.
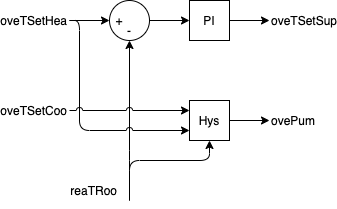
The model assumes a pump with a constant head, which results in a fixed flow rate due to the fixed pressure drop coefficient of the radiator. The supply water temperature set point of the boiler is modulated using a PI controller that tracks zone operative temperature to follow the zone operative temperature setpoint, depicted as controller C1 in Figure 1 and shown in Figure 2 below. For baseline control, this setpoint is defined as the heating comfort setpoint plus an offset of 0.1 °C. The pump is switched on and off with hysteresis based on the indoor temperature with the heating set point as the low point and the cooling set point as the high point. It is assumed that the boiler exactly outputs the supply water temperature set point using an ideal controller depicted as C2 in Figure 1.
ovePum_activate [1] [min=0, max=1]: Activation signal to overwrite input ovePum_u where 1 activates, 0 deactivates (default value)
ovePum_u [1] [min=0.0, max=1.0]: Integer signal to control the stage of the pump either on or off
oveTSetCoo_activate [1] [min=0, max=1]: Activation signal to overwrite input oveTSetCoo_u where 1 activates, 0 deactivates (default value)
oveTSetCoo_u [K] [min=278.15, max=308.15]: Zone operative temperature setpoint for cooling
oveTSetHea_activate [1] [min=0, max=1]: Activation signal to overwrite input oveTSetHea_u where 1 activates, 0 deactivates (default value)
oveTSetHea_u [K] [min=278.15, max=308.15]: Zone operative temperature setpoint for heating
oveTSetSup_activate [1] [min=0, max=1]: Activation signal to overwrite input oveTSetSup_u where 1 activates, 0 deactivates (default value)
oveTSetSup_u [K] [min=293.15, max=353.15]: Supply temperature setpoint of the heater
reaCO2RooAir_y [ppm] [min=None, max=None]: CO2 concentration in the zone
reaPPum_y [W] [min=None, max=None]: Pump electrical power
reaQHea_y [W] [min=None, max=None]: Heating thermal power
reaTRoo_y [K] [min=None, max=None]: Operative zone temperature
weaSta_reaWeaCeiHei_y [m] [min=None, max=None]: Cloud cover ceiling height measurement
weaSta_reaWeaCloTim_y [s] [min=None, max=None]: Day number with units of seconds
weaSta_reaWeaHDifHor_y [W/m2] [min=None, max=None]: Horizontal diffuse solar radiation measurement
weaSta_reaWeaHDirNor_y [W/m2] [min=None, max=None]: Direct normal radiation measurement
weaSta_reaWeaHGloHor_y [W/m2] [min=None, max=None]: Global horizontal solar irradiation measurement
weaSta_reaWeaHHorIR_y [W/m2] [min=None, max=None]: Horizontal infrared irradiation measurement
weaSta_reaWeaLat_y [rad] [min=None, max=None]: Latitude of the location
weaSta_reaWeaLon_y [rad] [min=None, max=None]: Longitude of the location
weaSta_reaWeaNOpa_y [1] [min=None, max=None]: Opaque sky cover measurement
weaSta_reaWeaNTot_y [1] [min=None, max=None]: Sky cover measurement
weaSta_reaWeaPAtm_y [Pa] [min=None, max=None]: Atmospheric pressure measurement
weaSta_reaWeaRelHum_y [1] [min=None, max=None]: Outside relative humidity measurement
weaSta_reaWeaSolAlt_y [rad] [min=None, max=None]: Solar altitude angle measurement
weaSta_reaWeaSolDec_y [rad] [min=None, max=None]: Solar declination angle measurement
weaSta_reaWeaSolHouAng_y [rad] [min=None, max=None]: Solar hour angle measurement
weaSta_reaWeaSolTim_y [s] [min=None, max=None]: Solar time
weaSta_reaWeaSolZen_y [rad] [min=None, max=None]: Solar zenith angle measurement
weaSta_reaWeaTBlaSky_y [K] [min=None, max=None]: Black-body sky temperature measurement
weaSta_reaWeaTDewPoi_y [K] [min=None, max=None]: Dew point temperature measurement
weaSta_reaWeaTDryBul_y [K] [min=None, max=None]: Outside drybulb temperature measurement
weaSta_reaWeaTWetBul_y [K] [min=None, max=None]: Wet bulb temperature measurement
weaSta_reaWeaWinDir_y [rad] [min=None, max=None]: Wind direction measurement
weaSta_reaWeaWinSpe_y [m/s] [min=None, max=None]: Wind speed measurement
EmissionsElectricPower [kgCO2/kWh]: Kilograms of carbon dioxide to produce 1 kWh of electricity
EmissionsGasPower [kgCO2/kWh]: Kilograms of carbon dioxide to produce 1 kWh thermal from gas
HDifHor [W/m2]: Horizontal diffuse solar radiation
HDirNor [W/m2]: Direct normal radiation
HGloHor [W/m2]: Horizontal global radiation
HHorIR [W/m2]: Horizontal infrared irradiation
InternalGainsCon[1] [W]: Convective internal gains of zone
InternalGainsLat[1] [W]: Latent internal gains of zone
InternalGainsRad[1] [W]: Radiative internal gains of zone
LowerSetp[1] [K]: Lower temperature set point for thermal comfort of zone
Occupancy[1] [number of people]: Number of occupants of zone
PriceElectricPowerConstant [($/Euro)/kWh]: Completely constant electricity price
PriceElectricPowerDynamic [($/Euro)/kWh]: Electricity price for a day/night tariff
PriceElectricPowerHighlyDynamic [($/Euro)/kWh]: Spot electricity price
PriceGasPower [($/Euro)/kWh]: Price to produce 1 kWh thermal from gas
TBlaSky [K]: Black Sky temperature
TDewPoi [K]: Dew point temperature
TDryBul [K]: Dry bulb temperature at ground level
TWetBul [K]: Wet bulb temperature
UpperCO2[1] [ppm]: Upper CO2 set point for indoor air quality of zone
UpperSetp[1] [K]: Upper temperature set point for thermal comfort of zone
ceiHei [m]: Ceiling height
cloTim [s]: One-based day number in seconds
lat [rad]: Latitude of the location
lon [rad]: Longitude of the location
nOpa [1]: Opaque sky cover [0, 1]
nTot [1]: Total sky Cover [0, 1]
pAtm [Pa]: Atmospheric pressure
relHum [1]: Relative Humidity
solAlt [rad]: Altitude angel
solDec [rad]: Declination angle
solHouAng [rad]: Solar hour angle.
solTim [s]: Solar time
solZen [rad]: Zenith angle
winDir [rad]: Wind direction
winSpe [m/s]: Wind speed
No lighting model is included.
No shading model is included.
The model uses moist air despite that no condensation is modelled in any of the used components.
A simple, single circulation loop is used to model the heating system.
Fixed air infiltration corresponding to an n50 value of 10 is modelled.
The Peak Heat Day (specifier for /scenario API is 'peak_heat_day') period is:
The Typical Heat Day (specifier for /scenario API is 'typical_heat_day') period is:
All pricing scenarios include the same constant value for transmission fees and taxes of each commodity. The used value is the typical price that household users pay for the network, taxes and levies, as calculateed by Eurostat and obtained from: The energy prices and costs in Europe report. For the assumed location of the test case, this value is of 0.20 EUR/kWh for electricity and of 0.03 EUR/kWh for gas.
The Constant Electricity Price (specifier for /scenario API is 'constant') profile is:
The Dynamic Electricity Price (specifier for /scenario API is 'dynamic') profile is:
The Highly Dynamic Electricity Price (specifier for /scenario API is 'highly_dynamic') profile is:
The Electricity Emissions Factor profile is:
The Gas Emissions Factor profile is:
Options for /scenario API are 'low', 'medium', or 'high'.
Empty or None will lead to deterministic forecasts.
See the BOPTEST design documentation for more information.
Options for /scenario API are 'low', 'medium', or 'high'.
Empty or None will lead to deterministic forecasts.
See the BOPTEST design documentation for more information.